
November 24, 2025
Will AI make us smarter or dumber? The insights of Klöpping, Scherder and Online Dialogue
Reflection on Klöpping × Scherder by Simon Buil (Data Analyst at Online Dialogue)
The beginning of every A/B test analysis is pretty much the same. You specify the visitors who participated in the test and the visitors who also met the test goal. You do this for control and all variants. Then you put the results into a calculator To test the result.
To take work out of my own hands and make the whole process less error-prone, I've automated this beginning. After all, you no longer have to clone data from Google Analytics into Excel, just say hello to your trusty numpad.
I always analyze A/B test results in the analytics tool because the data is there more accurate. In addition, it allows you to dive deeper into the results so that you can really find out what caused the result.
I work a lot with Google Analytics so I chose a combination of Google Sheets and the Google Analytics add-on. This is a Google Sheets add-on which makes Google Analytics data available in Google sheets by making data requests. You can also schedule reports so that all data is ready for you as soon as the test is completed.
The Google Sheets add-on connects you to your Google Analytics account giving you access to all data views. The Google Analytics API reports the exact same data as the web app (unless the reports are sampled). I won't cover the basics of the Google Sheets add-on in this blog, but Moz has a good introduction guide written about the Google sheets add-on.
The analysis template is fully customizable so you can make it relevant to your situation. The template explains how to do this. Now the template is set up to analyze tests that can be identified in Google analytics with an event category and action. If you want to use the template you need to make a copy of the file.
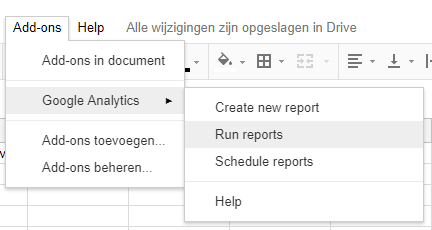
By specifying the test name, variant names, test page, test goal start and end date and pressing “Run reports” in the add-on, all data is retrieved for you. The template analyzes visitors (sessions), but reports user(s) who have seen the test page and users who also met the test goal on a total level and for the segments new/returning and desktop/tablet/mobile visitors.
Before you can analyze a test you will have to change a few things in the template. The process consists of 4 steps.
1. Enter Google Analytics data display code:
In the URL of the relevant Google Analytics data view, look up the numbers after the “p” and before the “/”. This you paste after “go:”.
![]()
So in this case, “go:48738444”.
2. Specify/isolate visitors in the test:
First, you need to isolate the visitors in the test so you select the test period. Then you want to analyze the visitors in the test by specifying the event category and actions. But as I mentioned earlier this can also be customized to a Google Experiment Name and variant, the custom dimensions used by VWO or other dimensions relevant to you.
3. Create test page and test target segments
A ‘conditions segment’ is created of visitors who have seen the test page and a ‘range segment’ for visitors who have additionally achieved the test goal from the test page. You must specify the test page and test goal as API code in the segments block. At the bottom of the segments block, the segments used by the API are displayed.
The links below can help you specify your test page and test target:
4. Get the data and analyze the results
Clicking “Run reports” retrieves the data, segments it and displays it in the results block.
In addition to retrieving the data at the main level, the template segments by user type and device category (if you selected this).
Below is an example of the results of a test that ran on desktop and tablet:
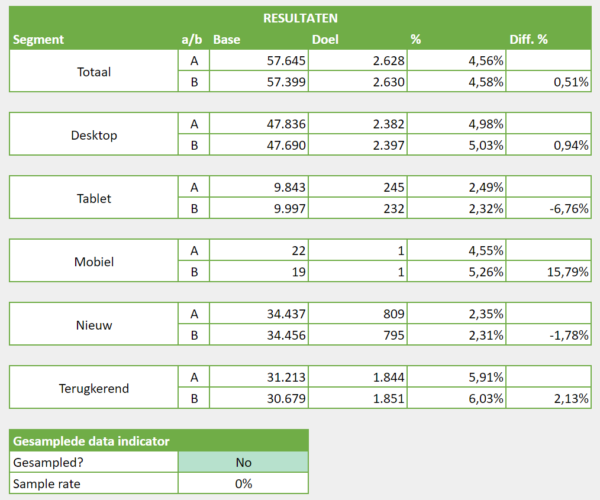
NOTE: At the bottom of the results table is a sampled data indicator that indicates whether the data has been sampled and what the sample rate is. If the data is sampled you can split the analysis period into multiple periods or you are forced to analyze it in the Google Analytics web app anyway.
This is one of the many application of the API but you could really automate everything. You need to invest some time to learn the add-on but in the end it will save a lot of hours in Google Analytics. I hope I was able to help you reduce your analysis time so you can better focus on in-depth behavior change analysis.
All relevant links about the Google Analytics API:
The Google Sheets add-on:
https://chrome.google.com/webstore/detail/google-analytics/fefimfimnhjjkomigakinmjileehfopp
What is the core reporting API:
https://developers.google.com/analytics/devguides/reporting/core/v3/
Introducing the Google Analytics add-on for sheets:
https://moz.com/blog/intro-google-analytics-add-on-for-sheets
Easily build data requests and use segments from your GA account:
https://ga-dev-tools.appspot.com/query-explorer/
All metrics and dimensions:
https://developers.google.com/analytics/devguides/reporting/core/dimsmets
How to use segments and filters:
https://developers.google.com/analytics/devguides/reporting/core/v3/segments
Can you use the chosen metrics and dimensions together?
https://www.kaushik.net/avinash/hits-sessions-metrics-dimensions-web-analytics/
This article was published on Oct. 18 at webanalists.com