This article was published on June 28 at webanalists.com

November 24, 2025
Will AI make us smarter or dumber? The insights of Klöpping, Scherder and Online Dialogue
Reflection on Klöpping × Scherder by Simon Buil (Data Analyst at Online Dialogue)
During Conversion Hotel 2017 I had the opportunity to attend two presentations by CRO godfather Ronny Kohavi. One of the things he mentioned several times was checking for Sample Ratio Mismatch (SRM) in your experiments. He shared on Twitter a Excel file with the formula and I have been checking all experiment results with this ever since.
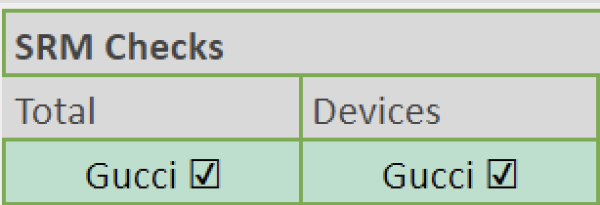
I added the check to my automated experiment analysis google sheet and months after using the formula I have not encountered an SRM error, everything was Gucci ✓
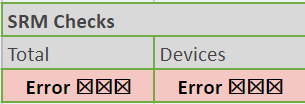
Until it did occur again....
I didn't know what to do or if I could trust the results. This article will prevent you from having to go through the same search for answers. I briefly answer the following questions:
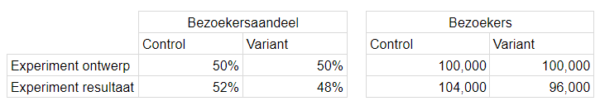
In a Sample Ratio Mismatch, the sample ratio does not match the design of an experiment. The distribution between control and variant is never exactly 50/50, and with an SRM check you check whether this difference is due to chance or not. In the example below, there is a Sample Ratio Mismatch:
An SRM check calculates the P value of an Experiment through a T- and/or a Chi-square-test. The P value indicates whether or not the visitor difference is due to chance. Here, the boundary condition is a P value below 0.001. This means that it can be said with a certainty of 99.9% that the difference is not due to chance and that something went wrong.
You do an SRM check at the total level but also within segments. There may be, for example due to a bug, many more Google Chrome visitors in the control group compared to the variant. An SRM is caused by a technical error and therefore you analyze the segments where you expect these errors. The visitor segments I analyze are:
In an SRM, there is an error that causes the visitor distribution to be skewed. You can investigate this in 5 ways:
The control or variant started a little later. As a result, one of the variants has already received visitors while the other is not yet live. You can rule this out by excluding the first hour or day from your analysis.
If you find a segment where an SRM occurs, you can better understand what caused the difference. Analyze the segments where you expect a difference:
Suppose that in the variant a specific segment does very well compared to control and that these visitors are much more frequent in the variant compared to control. That specific segment is then overrepresented and magnifies the positive effect. If the segment is underrepresented in the variant, then the effect of the segment is actually reduced because it is underrepresented.
See below an example where in control 52% are new visitors and in the variant 48%, an underrepresentation of new visitors in the variant relative to control.
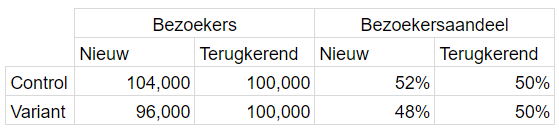
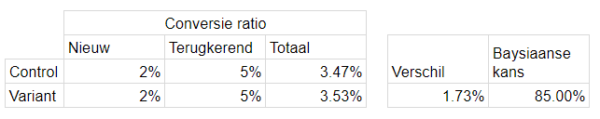
The experiment looks like a winner but the conversion rates for new and returning visitors are exactly the same. The under-representation of new visitors in the variant makes it seem like there is a conversion rate increase.
Depending on the size of the sample ratio mismatch, there are two options:
Ideally you fix the bug and put the experiment live again, but unfortunately this is not always possible and then this is an option.
Sources:
Advanced Topic from Microsoft experimentation team: Guardrails metrics
Tweet https://twitter.com/ronnyk/status/932798952679776256?lang=en
Formula https://t.co/U9WdHUbPGL
This article was published on June 28 at webanalists.com