
November 24, 2025
Will AI make us smarter or dumber? The insights of Klöpping, Scherder and Online Dialogue
Reflection on Klöpping × Scherder by Simon Buil (Data Analyst at Online Dialogue)
We see them all passing by, at work, on LinkedIn, at conferences: examples of A/B testing with 10%, 20% and 25% uplift. Nice to see what other companies are doing and good inspiration to enrich your own optimization program with. But there are some data pitfalls that can be misleading with these examples. Therefore, always ask the right questions.
One of the first questions I always ask with these types of examples: “What metric was used to bill this result against?” Ideally, you should bill an A/B test on a goal that actually generates additional sales. But of course, this depends on the bandwidth of your website. If you don't have enough traffic on your pages to settle on orders, the choice is often made to take click-through as a metric. Fine, but always include this, because an uplift of 15% in click-throughs is very different from the same uplift in orders and sales. Even if you take click-throughs as a metric, it is important to keep an eye on the final conversion rate. After all, the number of click-throughs is easy to influence, but if orders plummet because of your change then you may want to think about whether you actually want to implement the change.
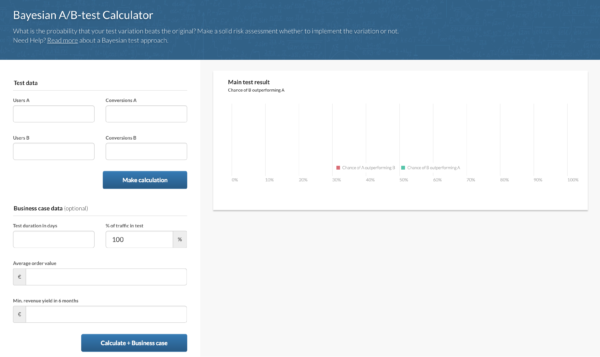
Too often we still see experiments being performed on pages that actually have far too little traffic to perform reliable A/B tests on. Therefore, whenever possible, always ask for the absolute numbers. Of course, an increase from 25 to 30 orders is very different from an increase from 600 to 720 orders. Still, both are an uplift from 20%. For the same reason, it is important to look in advance at how many visitors and conversions you need in order to test at all on a given page and whether the effect you see is actually statistically significant and not a coincidence. To do this, use an A/B test significance calculator such as, for example www.abtestguide.com.
Whether you have been doing A/B testing for a while or are just starting out, it is always important to properly check the implementation of your A/B testing tool. You can do this using a few set checks. Don't blindly trust the numbers your A/B testing tool shows. By sending an event to your web analytics tool for both the A and B variations, it is possible to do the analysis in your web analytics tool. Since you also do the rest of your web analytics in this tool, it's nice to be able to start from one truth. Also, your web analytics tool makes it easier to look at different segments when doing the analysis.
Next, make sure that all visitors on the page where the experiment takes place are distributed fairly between A and B. In total, 100% of the traffic on that page should be in the A/B test, and the distribution for each variant should be close to 50/50. To check that the distribution is actually 50/50, you can use the Sample Ratio Mismatch use Ronny Kohavi's (Microsoft) calculator.
Finally, it is important to ask yourself what the test has yielded in euros but, more importantly, what it has cost. Suppose the uplift earns you 20,000 euros in 6 months, but the development and additional costs are 17,500 euros, is it worth having this test built?
Anyway, these are the 4 pitfalls I encounter most often in my work, but I'm sure there are many more questions you can ask to determine the true value of your experiments. So be sure to share your own findings in the comments!
This article was published on June 28 at webanalists.com