March 5, 2026
Why experimentation is becoming an operating model for smart organizations
A conversation with Valentin Radu, founder of Omniconvert, on experimentation as an operating model, AI and sustainable digital growth. Read more
We are looking for new colleagues! Check out our vacancies.
This blog was written by two colleagues: Bas Boland, Developer and George Onderdijk, Data Insights Expert (Data Analyst). This article is the first part of a two-part series on how website performance affects your CRO program. These two specialists know how to explain the technical side of the job in normal human language. In this blog they discuss the importance of website performance, in the second part they share tips that you can get started with in practice.

When we look at optimizing websites, we tend to look at what elements on a page we can make bigger, prettier or easier to find. However, if it takes a long time for those elements to become available to the user, then all our efforts may be for naught. Users are increasingly demanding about experiences on a Web site. They compare it not only with competitors, but with the best experiences of sites they use every day. Therefore, it is very important to make sure that the speed of a website is also optimized.
Studies show that a faster website results in higher conversion rates. In doing so, they show that even improvements of a few hundred milliseconds can have a measurably positive effect on the bottom line:
Beyond the direct effect on conversion, better performance also ensures better ranking in search results, leading to increased visibility and traffic.
All in all, more and more companies are starting to recognize how important performance is to their customers' revenue and satisfaction. That's why in this blog we focus on how to apply it in the CRO process.
As support, Google has the Web Vitals brought to life.
This is a set of metrics that Google says together show how good the performance and related user experience is. Google itself takes these to determine the ranking of websites in their search results, and companies can use them to measure where the user experience is negatively affected. In addition, the Web Vitals provide a host of tips on what can be improved about a Web site, with respect to performance.
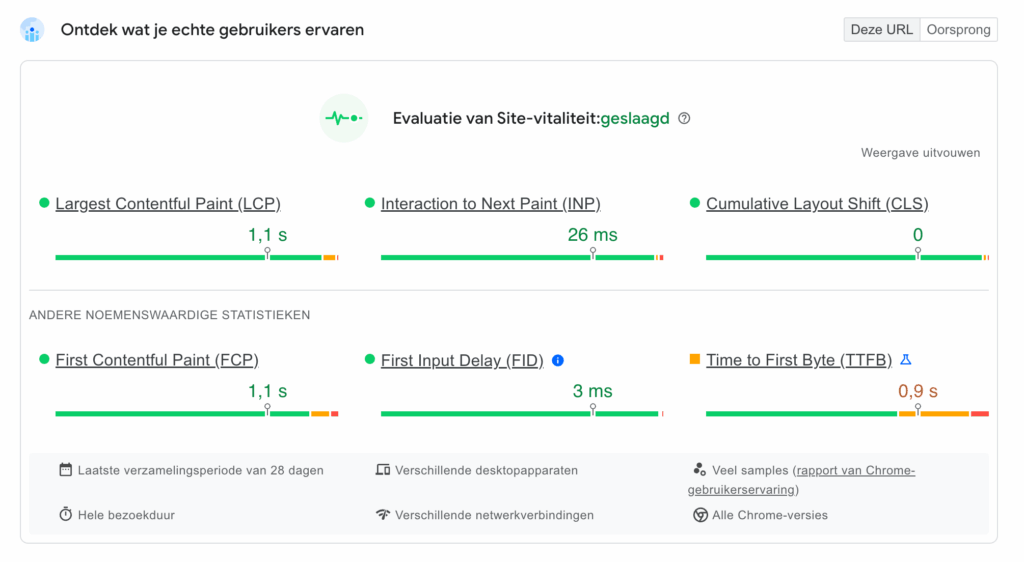
Largest Contentful Paint (LCP) measures the time it takes to load the most important content in the visible portion of the page. For example, an LCP of 10 seconds means that up to 10 seconds, so many changes are still happening on the page that it is less usable.
However, there is a pitfall to the LCP metric. Sometimes it is measured incorrectly because, for example, a popup or cookie banner that is triggered late is seen as a major modification.
However, because this affects SEO, it is still advisable to look at this metric and keep it as low as possible. To positively influence the Largest Contentful Paint we can include:
Interaction to Next Paint (INP) is a relatively new metric that has replaced First Input Delay (FID).
INP measures the response time between a user interaction, such as a click or a keystroke, and the moment the browser begins visually displaying the result of that interaction.
Thus, this metric is critical to understanding the ‘palpable’ speed of a website.
With a poor INP, the website is not immediately unusable, but things don't feel “smooth,” which is very distracting to a visitor. The website takes people out of the flow of their purchase.
Cumulative Layout Shift (CLS) measures how often elements on the page shift, both during page loading and afterwards.
A dynamic element such as an advertisement, information that is replaced, or a late-loading image that pushes the rest of the elements to the bottom, for example, falls under this.
We've all had a blog post whose text kept shifting or a button that shifts just before we want to click it.
A low CLS means that the page is very stable, which contributes to a good user experience.
To get a good CLS, it is important to use placeholders or, in the case of images, predefine the width and height in the code. This will show a white block with the same size, which prevents things from still shifting.
Every three weeks we send out a newsletter with the latest blogs, event updates and academy offerings. No spam, just information that actually benefits you. Join us and we'll keep you informed.
Google has released a JavaScript library that helps measure Web Vitals.
It can be built by the development team directly in the code or deployed as a tag in Google Tag Manager.
By implementing this library, we can send the Web Vitals to Google Analytics as parameters and use them in our analysis to track and improve website performance.
By looking at different pages or by segmenting, we can see where the biggest bottlenecks are and thus focus very purposefully on solving the biggest problems.
We can also use this data to create dashboards and generate automatic alerts when performance degrades. This unfortunately happens frequently after new releases from the development team or when implementing new tags in Google Tag Manager.
Just as in Conversion Optimization we make the website a little bit better all the time by improving the User Experience, we do the same thing on the backend by making performance a little bit better all the time.
Performance metrics can therefore perfectly be a part of the CRO process. By setting specific goals for each metric and continuously monitoring and improving them, we can make the website user experience even better.
Website performance is a fundamental part of the user experience and therefore a crucial part of the conversion optimization process.
By constantly striving to improve Web Vitals, companies can improve not only their SEO, but also their conversions.
