October 3, 2017
We are looking for new colleagues! Check out our vacancies.
Why a Bayesian A/B test evaluation delivers more
The traditional - and most widely used - method of analyzing A/B testing is with the so-called frequentist t-test. This is a scientifically valid method, but this method has two major drawbacks: the outcome of an A/B test is difficult to understand without solid statistical knowledge, and by recommending that only significant test results be implemented, you are missing out on a lot of money! A Bayesian test evaluation offers a solution in both cases.
What does a frequentist test result say?
In a frequentist A/B test evaluation, you compare the averages of two independent groups to see if they are significantly different from each other. The premise of this type of test is that there is no difference between the conversion rates of group A and B (the null hypothesis). You try to reject this hypothesis. You want to show that B works better than A. A predetermined significance level (often 90 or 95%) is used to determine how improbable the difference found in the test is between variant A and variant B. You assess this on the basis of the so-called p-value.
Sample frequentist test result
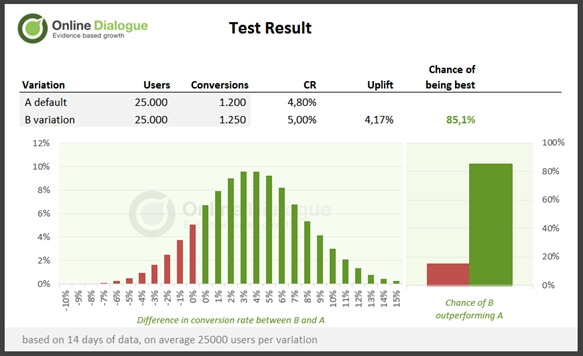
Suppose Company X ran an A/B test. Each variant had 25,000 visitors and the B variant had a measured conversion increase of +4.17%. The p-value of this test is then 0.150.

The graph above shows the measured difference in conversion rate between B and A and the 90% confidence interval for both variations. This is indicated by the dashed lines. If the bullet of variation B is outside the confidence interval of A then there is a significant difference. Based on a significance level of 90%, the result is that the B variant is not significantly different from the A variant (since 0.150 is greater than the critical limit of 0.1).
Advice with this frequentist test result
The variant does tend toward the positive side, but the difference is not large enough to be statistically significant. The recommendation based on this result is not to implement the variant. Insufficient evidence was found that the test idea contributes significantly to revenue increase. The A/B testing team will therefore pursue a new testing direction.
What does a Bayesian test result say?
Within Bayesian statistics, things are more nuanced. A test result is used to determine the probability that the variant performs better than the current situation. A test result is therefore not a binary result (winner or no winner), but a probability of 0% to 100%. This is a lot easier to communicate than ‘how unlikely the difference found is if you assume there is no difference’ (the conclusion based on the frequentist t-test).
Example Bayesian test result
If we look at the same example case and run a Bayesian test evaluation on it we see the following: the probability that variant B outperforms the original is 85.1%. Looking at the graph ‘difference in conversion rate between B and A,’ it can be seen that the difference in conversion is greater than 0% in 85.1% of the cases, with the highest probabilities between +1% and +6%.
Advice on this Bayesian test result
The question of whether to implement the variant at a probability of 85.1% leads to a considered risk assessment. Does a risk of 14.9% outweigh a probability of revenue increase of 85.1%? It can be argued that any test result with a probability greater than 50% should be implemented because there is a higher probability that B is better than A. However, the cost of testing (cost of test program and implementation of tests) is then not factored into the decision.
If the average order value is known and the minimum desired revenue of a test (for a good ROI), the probability that the B variant will actually yield this after implementation can also be calculated. In this example, the average order value is €75 and the minimum return of €25,000. This amount should be recovered within 6 months after implementation.
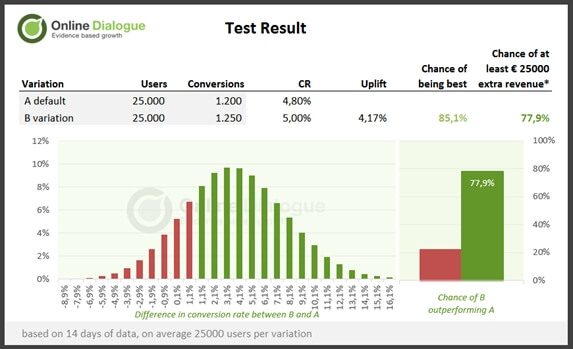
The probability of this in this example is 77.9% (this represents a difference in conversion of at least 1.08%). These figures provide more guidance in making a decision for whether or not to implement the variant. In this case, the decision is likely to be positive to implement the variant. While the test idea was not significantly proven, this result indicates that the test direction was the right one. Subsequent tests can continue to embroider on this idea.
Conclusion: switch!
By moving to a Bayesian test evaluation, A/B test conclusions and actions can be conveyed without statistical jargon. A Bayesian test evaluation gives a simpler answer to the question of whether variant B is better than the current situation, namely with a probability of 0 to 100%. This is understandable to everyone.
In addition, with Bayesian test evaluation, you implement not only the obvious winners (from which you actually learn something), but also variants that indicatively increase revenue (but from which you don't gain any hard behavioral insights). With each test result, you do the weighing whether the expected opportunity for additional sales outweighs the risk you run. As a result, more variants will be implemented, ultimately resulting in higher sales growth.
Meanwhile, we analyze and visualize all our A/B tests at our clients via Bayesian test evaluation. We described this transition in this English-language document (PDF), which you can download for free here.
