
March 5, 2026
Why experimentation is becoming an operating model for smart organizations
A conversation with Valentin Radu, founder of Omniconvert, on experimentation as an operating model, AI and sustainable digital growth. Read more
We are looking for new colleagues! Check out our vacancies.
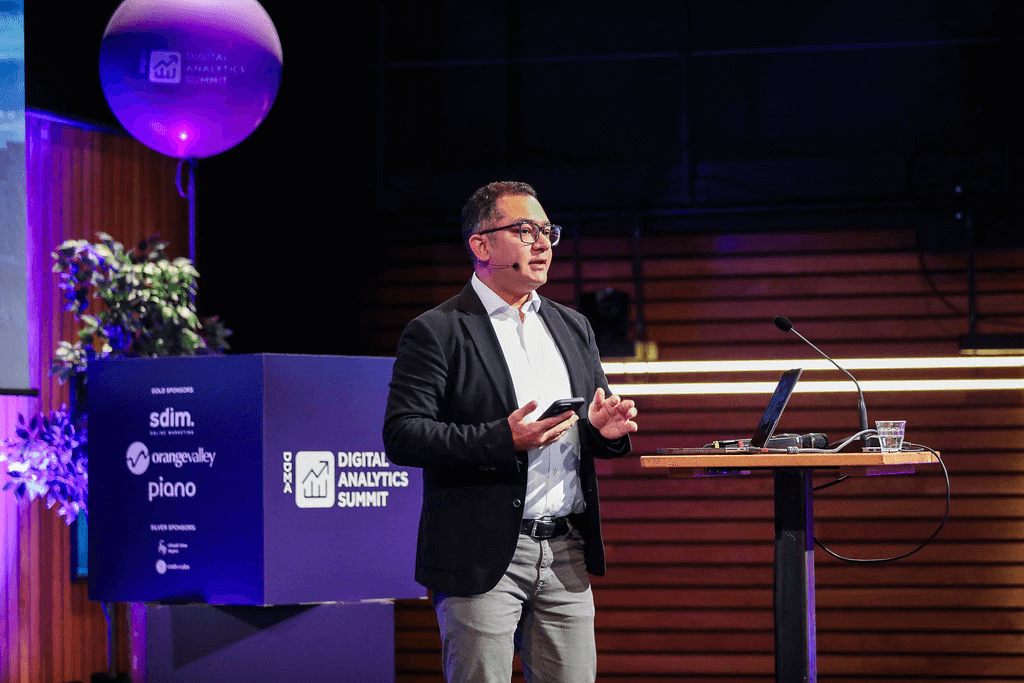
Last Thursday, October 12, the Digital Analytics Summit 2023 was held at Pakhuis de Zwyger in Amsterdam. A knowledge and networking event created to bring specialists and managers, who work with digital analytics on a daily basis, up to date on data, analytics and digital marketing. Digital analytics from head to tail, in other words. From collecting data to reporting insights, but also about the various techniques and regulations that may apply to it.

In the three rooms of the impressive building on ‘t IJ, which incidentally used to serve as a cold storage warehouse, there was room in the program this day for some very interesting speakers from home and abroad. Analytics Power Hour podcast creator and self-proclaimed “analytics dinosaur” Tim Wilson was one such. But there were more interesting speakers... I made a personal selection, and because of the extensive program, I made the most of it and that's exactly 50% (saw 8 out of 16 speakers). Or do I now have a 100% score? :). It's just how you look at the data. Let that be just about the thread of the day. What exactly is analytics? How do you look at it as a specialist, but more importantly, how does your client look at it? And what questions are asked?
Sometimes some of the stories sounded like old wine in new bags, but that's exactly what it wasn't. The analytics community has tried a lot, failed a lot, learned a lot (GA4 not to forget!) and some interesting insights were therefore shared with us today. For example, that we always fall for the fact that data collection is very important and that there would be business value in it too! Nope, it's much more about its potential value. In addition, we still have much more to gain from that human, creative brainpower of the analyst.
Read on quickly and get the potential value from the take aways of the 6 speakers I saw and heard.
Ibrahim Elawadi, Global Director, Marketing Analytics (Philips)
Ibrahim Elawadi bit the bullet. As Global Director of Marketing Analytics at Philips, he addressed two questions: “How do you know analytics works?” and “How do you measure its value?”. This also kind of stems from the following: in fact, there are estimates that only 20% of analytics insights actually drive a particular business outcome.
Takeaways:
Peter O'Neill, Head of Digital Analytics (Decathlon)
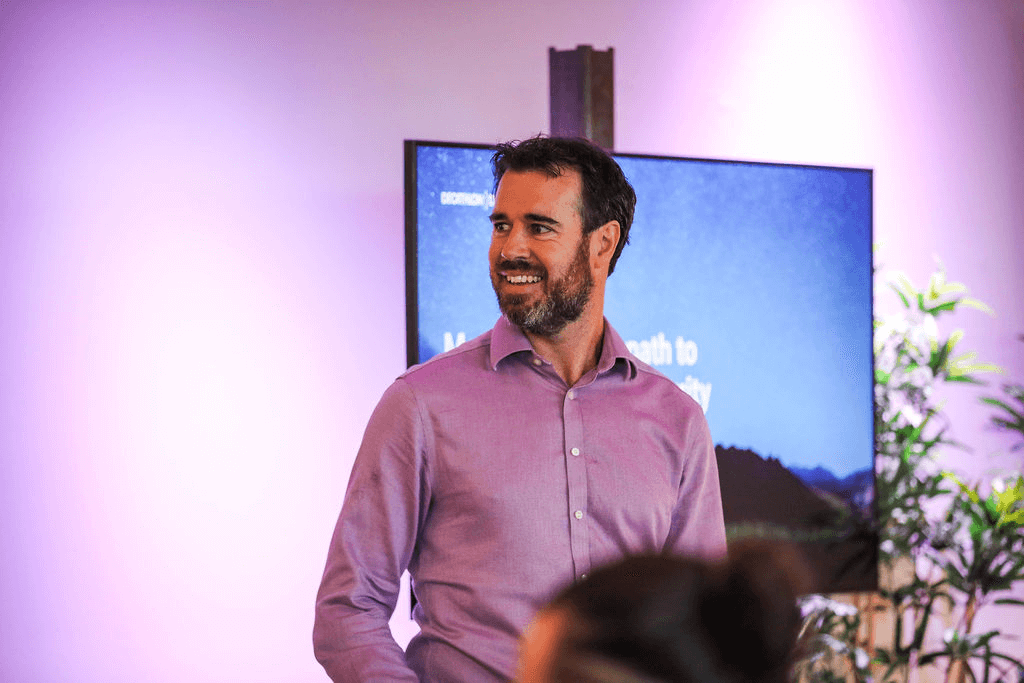
In addition to his new position as Head of Digital Analytics at Decathlon, Peter O'Neill is best known as founder of MeasureCamp, the world's largest analytics unconference. Since joining Decathlon only 3 months ago, Peter has been mapping the current digital analytics maturity of the organization. In his talk, he made it clear that Decathlon is not making enough impact at the moment, but he also explained how he plans to improve this over time in order to make an impact.
Takeaways:
Director of Data & Consumer Analytics (DPG Media).

With 14 million unique visitors per day, the network of DPG Media in the Netherlands and Belgium has an incredible reach. Good content on websites like AD.nl or Nu.nl is important and this figure shows that, but what drives visitors to read even more and what success metric do they look at?
The key KPI is the number of returning days per visitor in the past 28 days. At least, that has been the main engagement metric for the past 2 years. Through the conduct of an experiment, they have come to interesting new insights that need to be explored further.
Takeaways
Tim Wilson, Co-Host Analytics Power Hour (analyticshour.io)

Tim Wilson is an analytics veteran or an “analytics dinosaur” as he also calls himself. He has worked for Fortune-500 companies for more than 20 years, advising them internally at various levels. In this talk, which he told me he spent months tinkering with, his message is very clear: “Why do we spend so much time collecting data and so little on actually using that data meaningfully?” Like Ibrahim Elawadi earlier in the day, Tim's talk is also about working with data, what you do with it next and exactly what value you get out of it. The latter in particular is something that has bothered Tim for years. So in his view, this is not being done enough.
We seem to get caught up in thinking time and again that data collection and data management are about business value, but it's more about potential value. This is an important difference and it is very easy to get sucked into this thinking. According to Tim, we need a framework for the different ways we use data.
Take aways
Jill Quick, Analytics Consultant and Trainer (The Coloring in Department)
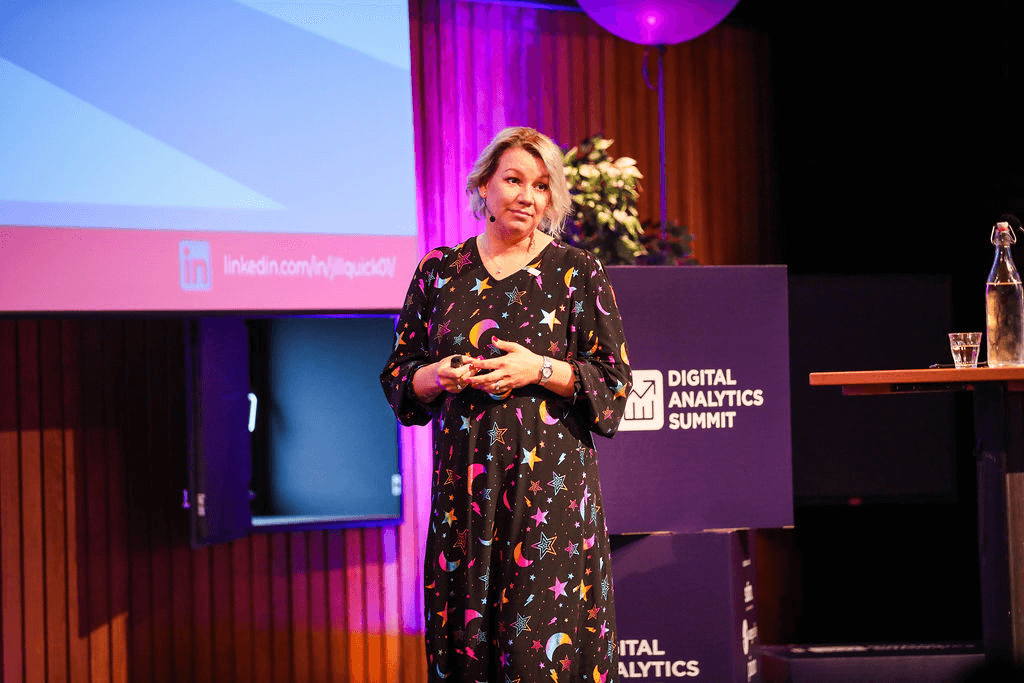
Jill Quick is a colorful and versatile analytics jack-of-all-trades. As a consultant for ‘The Coloring in Department,’ she helps organizations with all things tracking. These have recently been many GA4 implementations, but she also does data visualization. This is report generation and BigQuery. In her talk, she discussed breaking what she describes as a “data tradition” and had some fun anecdotes from her clients' practices:
“We have migrated but it doesn't feel right. Make GA4 like UA! All our reports are broken and nothing matches what we had as a baseline in UA”.
Takeaways
Yael Farkas, Head of Digital Intelligence (Douglas)
Yael Farkas' passion lies in creating value from data, reflecting her ongoing commitment to shaping the digital landscape at Douglas. During her talk, she dwelt on how it all started: with an infinite number of tickets to answer simple data questions that provide absolutely no value. She also showed how she transformed Douglas' organization into one that is largely self-sufficient in data.
Takeaways
Ashit Kumar, User Growth Lead (Spotify)

Ashit and his team are responsible for running 100 experiments a year on Spotify's website. Meanwhile, the platform has 220 million subscribers (50% is Premium) and 551 million active users. By the way, these figures are from June this year. With a team of 11 people, they work together intensively remotely, so the team is also highly dependent on each other when it comes to development, data analysis and designing the experiments.
The tooling used consists of a mix of Google Analytics, BigQuery, Conductrics, Airtable, Github, Figma and Jupyter. The team is now running well but this was difficult to organize at first because how do you scale up in a world where almost all team members work in different time zones?
Take aways
The final speaker of Digital Analytics Summit 2023 was Parvathy K. Krishnakumari, Chief Technology Officer of the Analytics for a Better World Institute. Her talk was very inspiring to everyone in the room. The institute combines capabilities of nonprofit organizations, academia and businesses to contribute to the United Nations Sustainable Development Goals (SDGs).
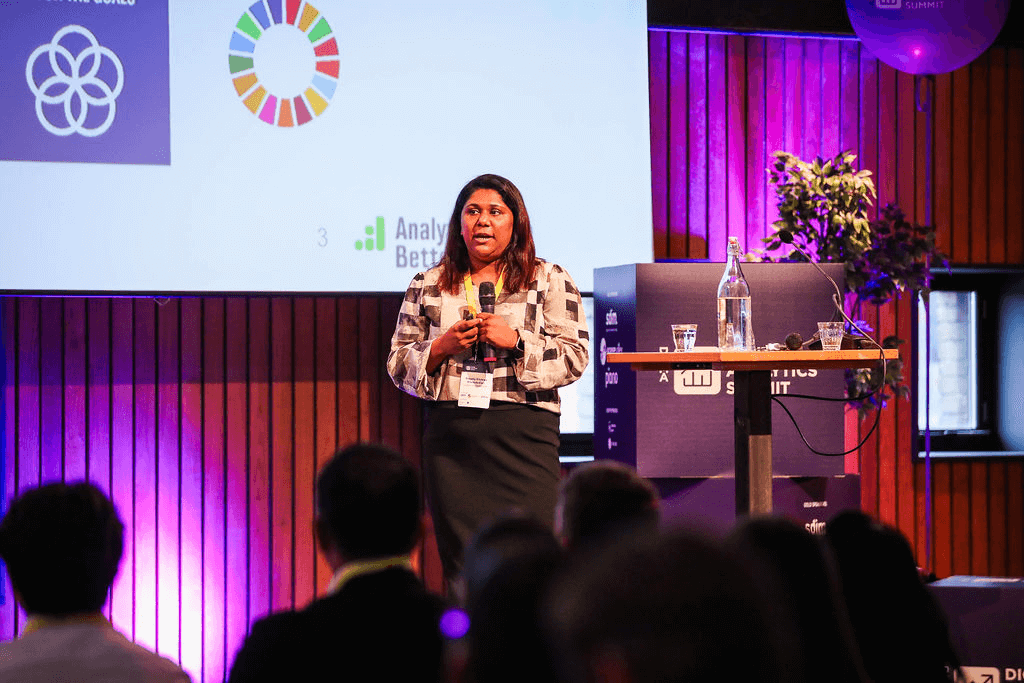
It gave an impressive insight into how analytics can also be used, namely to make the world a little better again. A good reminder for myself and also for many organizations in the room. Perhaps analysts should devote their knowledge and power to a sustainable project. Analytics, for a better world!
... Just a quick note: we send out a newsletter every three weeks that includes the latest blogs, team updates and, of course, news about the offerings in our academy. Click here to subscribe.
The interest in the talks during this edition of the Digital Analytics Summit was probably very personal for everyone. Want to take away more knowledge about GA4 and BigQuery? Or hear about Privacy by Design? It was all covered because the program was well balanced and therefore very well put together by the DDMA commitee. My compliments!
What potential value I got out of this day? That a good digital analytics maturity scan always provides good insight into what an organization needs. That analytics itself has no business value, but at most a potential value. That your customers or stakeholders are not machines but people, just like you, the analyst. People with creative ideas and these ideas you have to keep exploring and finally, therefore don't talk data but ask what is on someone's mind. Ask the why question more often. Why? Well, why...
Want to know more about GA4? Click here for our GA4 Training.
Want to learn more about BigQuery? Click here for our BigQuery Training.
Photos: https://digitalanalyticssummit.nl