October 3, 2017

We are looking for new colleagues! Check out our vacancies.
10 Tips to Double the ROI from Google Analytics Analytics

It's easy to get lost in the Google Analytics environment. With literally hundreds of options, how do you spend your time most effectively?
In this blog post, I will give you 10 tips to dramatically increase the return from your Google Analytics activities.
Tip 1: Pre-select favorite data views
This is a must when you have access to multiple accounts, properties and data views (profiles) within each website.

- Navigate to the Google Analytics home page.
- Enter your favorites (starred) by account, property or view level.
- The next time you log into your Google Analytics account, you can easily filter for the data views you need.
It then looks like this:

In addition, within the property settings, you can select a default data view that is preselected when you go to the reporting environment.
Tip 2: Start every analysis with a question
What do you want to solve or improve? Where are possible opportunities?
It's fun to wander around Google Analytics for a while, but if you want to be effective with your time, it really needs to be different.
An example is shown here:
Context: increase number of newsletter subscriptions.
Question: does “seeing” a higher percentage of a page's content lead to an increased number of newsletter signups?
Action: implement scroll-tracking and analyze the relationship between “page consumption” and conversion.
Within this analysis, you are focused on improving the website's efficiency. Thus, there are numerous analyses you can make (periodically) that relate specifically to your Web site or business model.
Tip 3: Set up Google Analytics annotations
Annotations make an analyst's life a lot easier.
When set up properly, they help tremendously with analytics. Using annotations, you can easily track events that might affect your conversion in Google Analytics.
Consider:
- Change in product offerings.
- Products temporarily unavailable.
- Price changes competitor.
- Offline presence at a trade show.
- Extreme weather.
Be sure to focus on the most interesting things and not try to keep up with everything.
Two ways
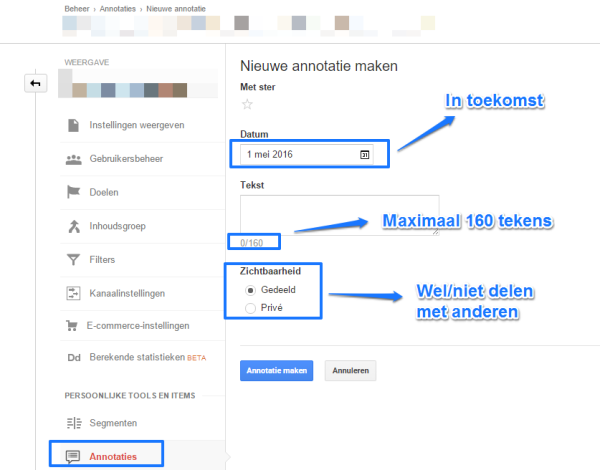
Google Analytics annotations can be set up within the administrator interface or reporting environment.
The advantage of setting up annotations within the administrator interface is that they can also be set for future events.
Here's how to create them within the administrator interface:
Tip 4: Use basic keyboard shortcuts in Google Analytics
What many of you may not know is that Google Analytics can be controlled with a number of keyboard shortcuts, an absolute “timesaver”!
When you are logged into your Google Analytics account and click on question mark (?), you will see the following help menu:
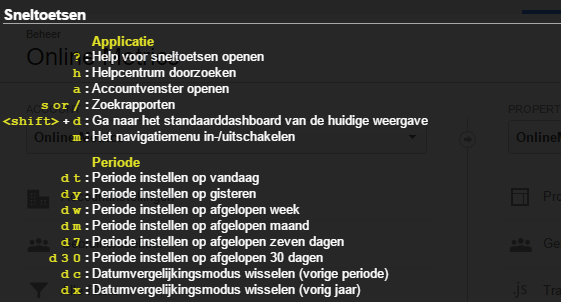
Some application features, but the “period” features in particular are very useful!
You can very quickly view the dates of today, yesterday or any other time period.
Often useful when doing an initial analysis or a hands-on workshop.
Tip 5: Set up custom segments
Segmentation is the key to insights and growth!
One of the best features in Google Analytics is segmentation.
Accessible to all and a nice list of basic segments is already available:
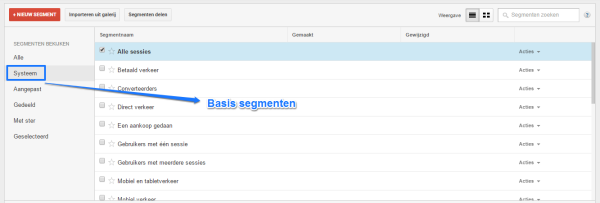
These already enable you to do better, segmented analysis.
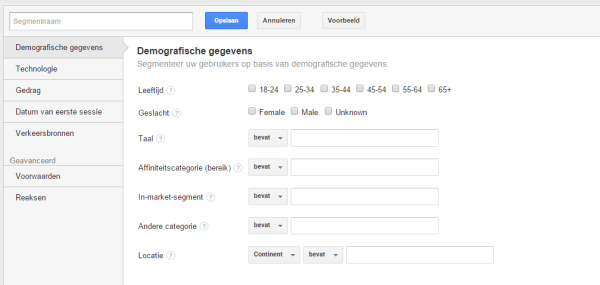
But if you really want to get the most out of Google Analytics data and segmentation, I recommend setting up custom segments:
 My advice:
- Delve into your business and visitors (segments).
- Map out some key areas where you could potentially optimize.
- Arrange the necessary segments.
- Analyze your data and turn the insights into action.
A good knowledge of regular expressions, is a must if you want to get the most out of this feature.
Tip 6: Set up custom reports
A custom report provides the ability to display key statistics within a single report.
Example:
Context: increase conversion in funnel.
Question: within the different traffic channels, are there large deviations in throughput per funnel step?
Action: create a goal per funnel step and include all statistics in a custom report.

Goal CR 1 relates to the conversion point.
Goal CR 2 through 5 are linked to steps 1 through 4, respectively.
On the left side, “medium” is shown as a dimension. Using this target set up and the custom report, it is easy to analyze the different traffic channels relative to each other.
And you get instant insight into how the different channels are performing in the different funnel steps. Where are your opportunities?
Note: within Google Analytics, by default it is not possible to segment within the funnel view reporting.
Tip 7: Set up custom notifications
Custom notifications are very useful if you want to be automatically notified of certain changes.
These are generated when traffic (or conversion) has reached a certain threshold that you have specified.
Here is a simple example:
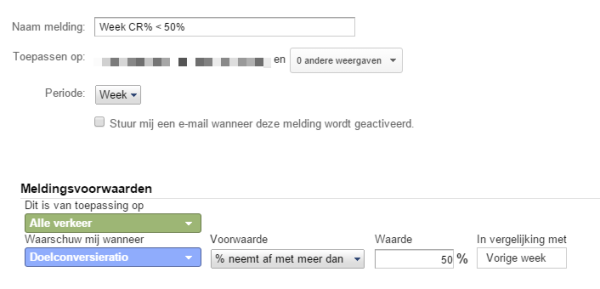
Determine your own benchmarks and what you want to monitor. It is also a good method to detect (technical) issues when you link the notification to an email.
For inspiration: A list of 55 custom reports from LunaMetrics.
Tip 8: Use a spreadsheet when measuring campaigns
Google Analytics recognizes organic, direct and referral traffic. With proper integration with Google AdWords, this traffic is also recognized automatically.
To also measure email, affiliates and other channels, the landing pages of traffic from these channels should be provided with the correct “utm codes.”.
My advice is to use a spreadsheet when you need to set up additional tagging frequently and for different channels.
Tip 9: Save your favorite reports (shortcuts)
You modified a report, applied filters and added an extra segment over it. And tomorrow you return, you have to create the report all over again?
No, definitely not, there is a smarter method: use a shortcut!
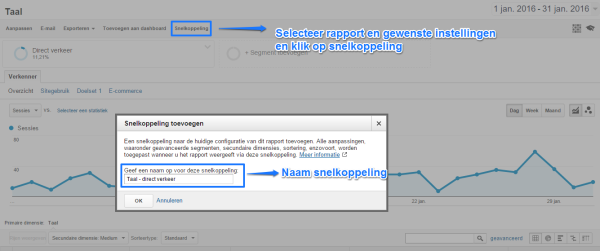
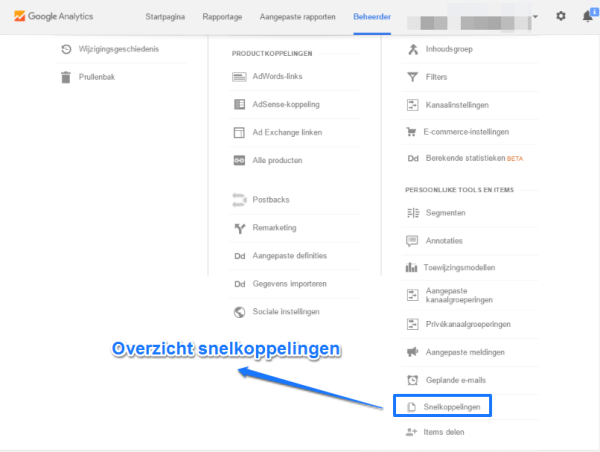
Within the admin settings, you can then view all your shortcuts and delete old shortcuts, if necessary.
Tip 10: Use the search function within Google Analytics
Google Analytics makes it easy to quickly navigate to favorite reports:
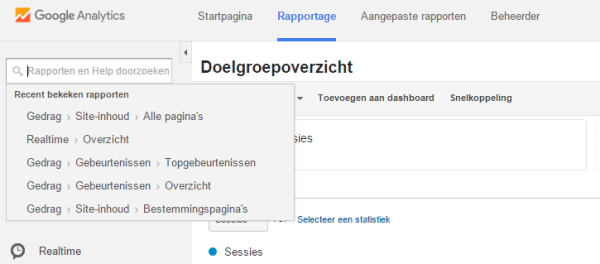
By default, your recently viewed reports are displayed here.
But it is also possible to search shortcuts, reports and custom reports. This is often faster than using the normal navigation.
__________________________________________________
This article was published on Feb. 15 at Webanalists.com
 Nederlands
 English